

Prior to iOS 6, the iPhone’s Safari web browser had a built-in Debug Console that could be used by developers to track down webpage defects. If you have an iPhone running an early version of iOS, you can access the Debug Console through Settings > Safari > Developer > Debug Console. Whenever Safari on the iPhone detects CSS, HTML, and JavaScript errors, details of each are displayed in the debugger.
All the recent versions of iOS use Web Inspector instead. You activate it in the Safari settings on the iPhone or another iOS device, but to use Web Inspector, you connect the iPhone to your Mac computer with a cable and open the Mac’s Safari, where you enable the Develop menu in Safari’s Advanced Preferences. Web Inspector is only compatible with Mac computers.
Activate Web Inspector on iPhone
The Web Inspector is disabled by default since most iPhone users have no use for it. However, it can be activated in just a few short steps. Here’s how:
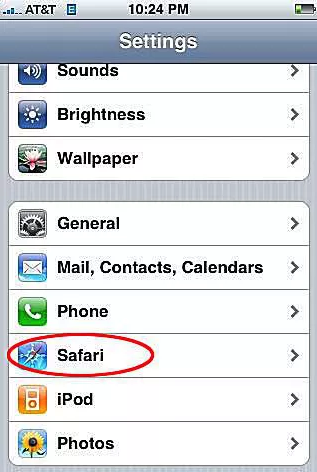
- Tap the Settings icon on the iPhone Home screen.
- Scroll down until you reach Safari and tap on it to open the screen that contains everything related to the Safari web browser on your iPhone, iPad, or iPod touch.
- Scroll to the bottom of the screen and tap Advanced menu.
- Toggle the slider next to Web Inspector to the On position.
Connect iPhone to Safari on a Mac
To use the Web Inspector, you connect your iPhone or another iOS device to a Mac that’s running the Safari web browser. Plug your device into the computer using a cable and open Safari on your computer.
With Safari open, do the following:
- Click Safari in the menu bar and choose Preferences.
- Click the Advanced tab
- Select the box next to Show Develop menu in menu bar.
- Exit the settings window.
- Click Develop in the Safari menu bar and select Show Web Inspector.

